| Folien zu Vorträgen | Daten | Publikationen | Links | |||
| About me |
|---|
| Medienspiegel/In the Media |
 |
back to overview previous slide next slide Click on the slide to get it in print quality within a new screen. |
|---|
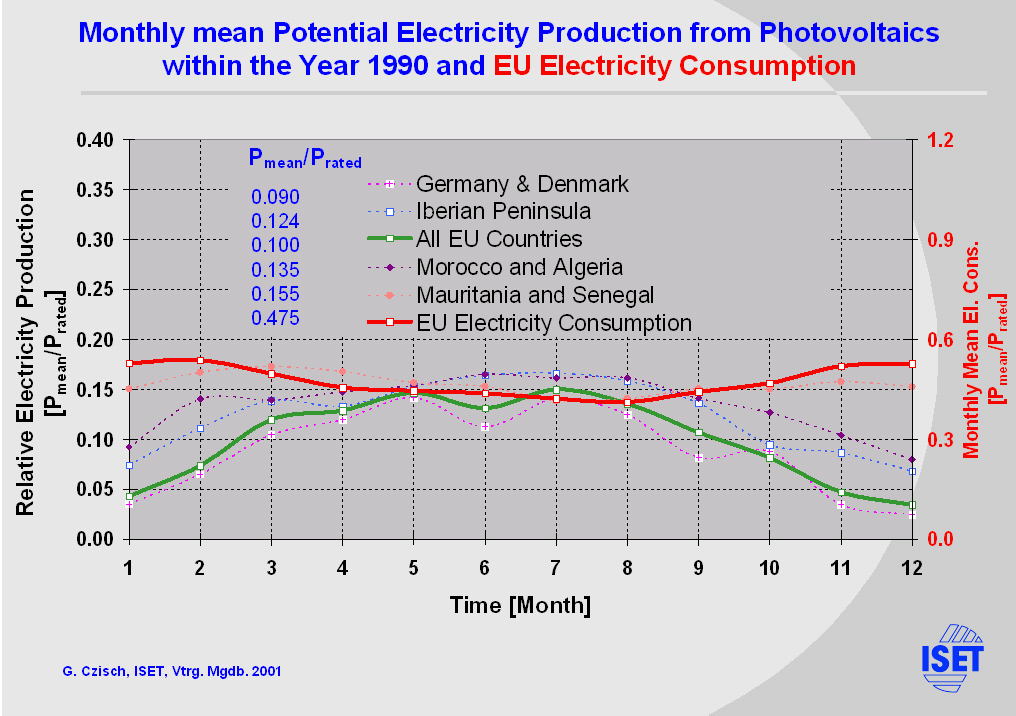
| The monthly variation of PV power production can be studied in more detail comparing the different graphs on this slide. They
show monthly averages for selected regions contrasted with the electricity consumption of the member states of the EU. In this example only the production of Mauritania and Senegal in the Southern Sahara show a monthly variation similar to the mentioned electricity consumption. Within all the other regions the behaviour more or less shows an anticyclical pattern compared to the demand. |
|---|
Impressum
Verantwortlich: G. Czisch; Gestaltung: C. Budig, G. Czisch, W. Flemming