| Folien zu Vorträgen | Daten | Publikationen | Links | |||
| About me |
|---|
| Medienspiegel/In the Media |
 |
Back to overview Go to the next slide, to the previous slide Click on the slide to get it in print quality within a new screen. |
|---|
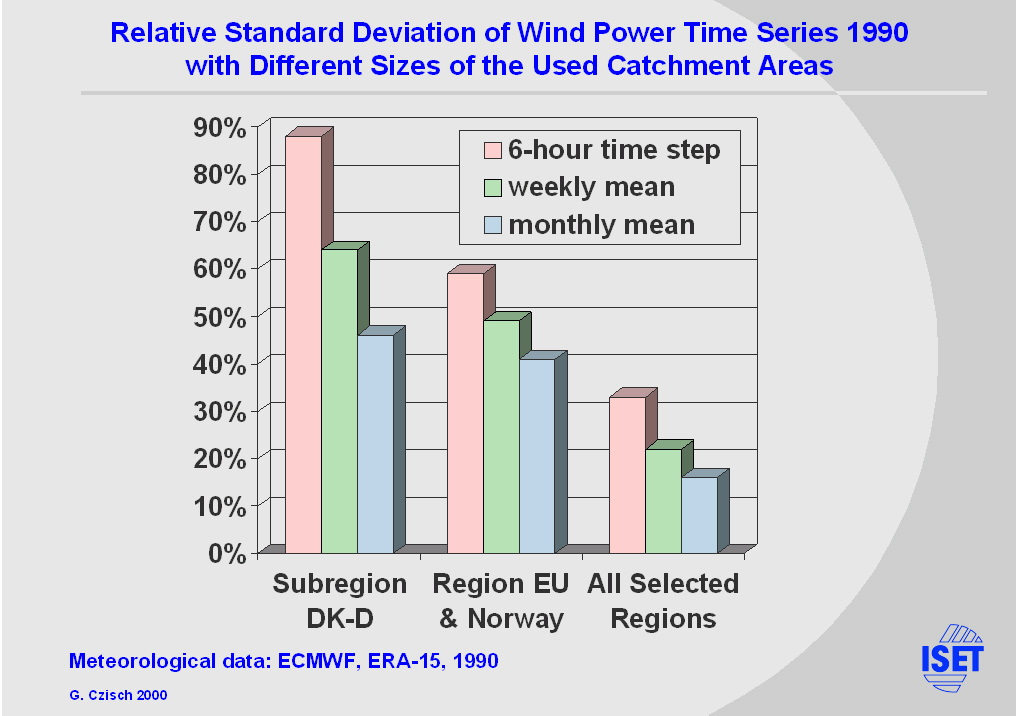
The change of the temporal behaviour of wind power production from different catchment areas can bee seen comparing its weighted standard deviations (STD/mean production). Here the results are shown for three different averaging times and three areas. The smallest only includes good wind sites in Germany and Denmark (DK-D). |
|---|